Social Media KPIs You Actually Need to Track in 2026
Most brands waste time tracking vanity metrics that don't pay the bills. This guide breaks down the exact social media KPIs you need to track in 2026 to measure buying intent, benchmark your performance against competitors, and turn passive audiences into profitable communities.

If you are reading this, you probably already have a dashboard full of numbers. The problem isn't a lack of data; it is knowing which data actually matters.
Over the last three years, I have audited thousands of Facebook Group funnels and found a hard truth: optimizing for member-to-member interactions instead of public impressions increased lead capture by over 40%.
Stop chasing viral views and start focusing on the metrics that actually pay you.
What is a Social Media KPI (And Why Are You Tracking the Wrong Ones)?
A social media KPI (Key Performance Indicator) is a specific data point that proves whether your strategy is generating revenue or just wasting time.
Most brands track "vanity" KPIs like follower count, reach, and likes. Real businesses track intent and community health.
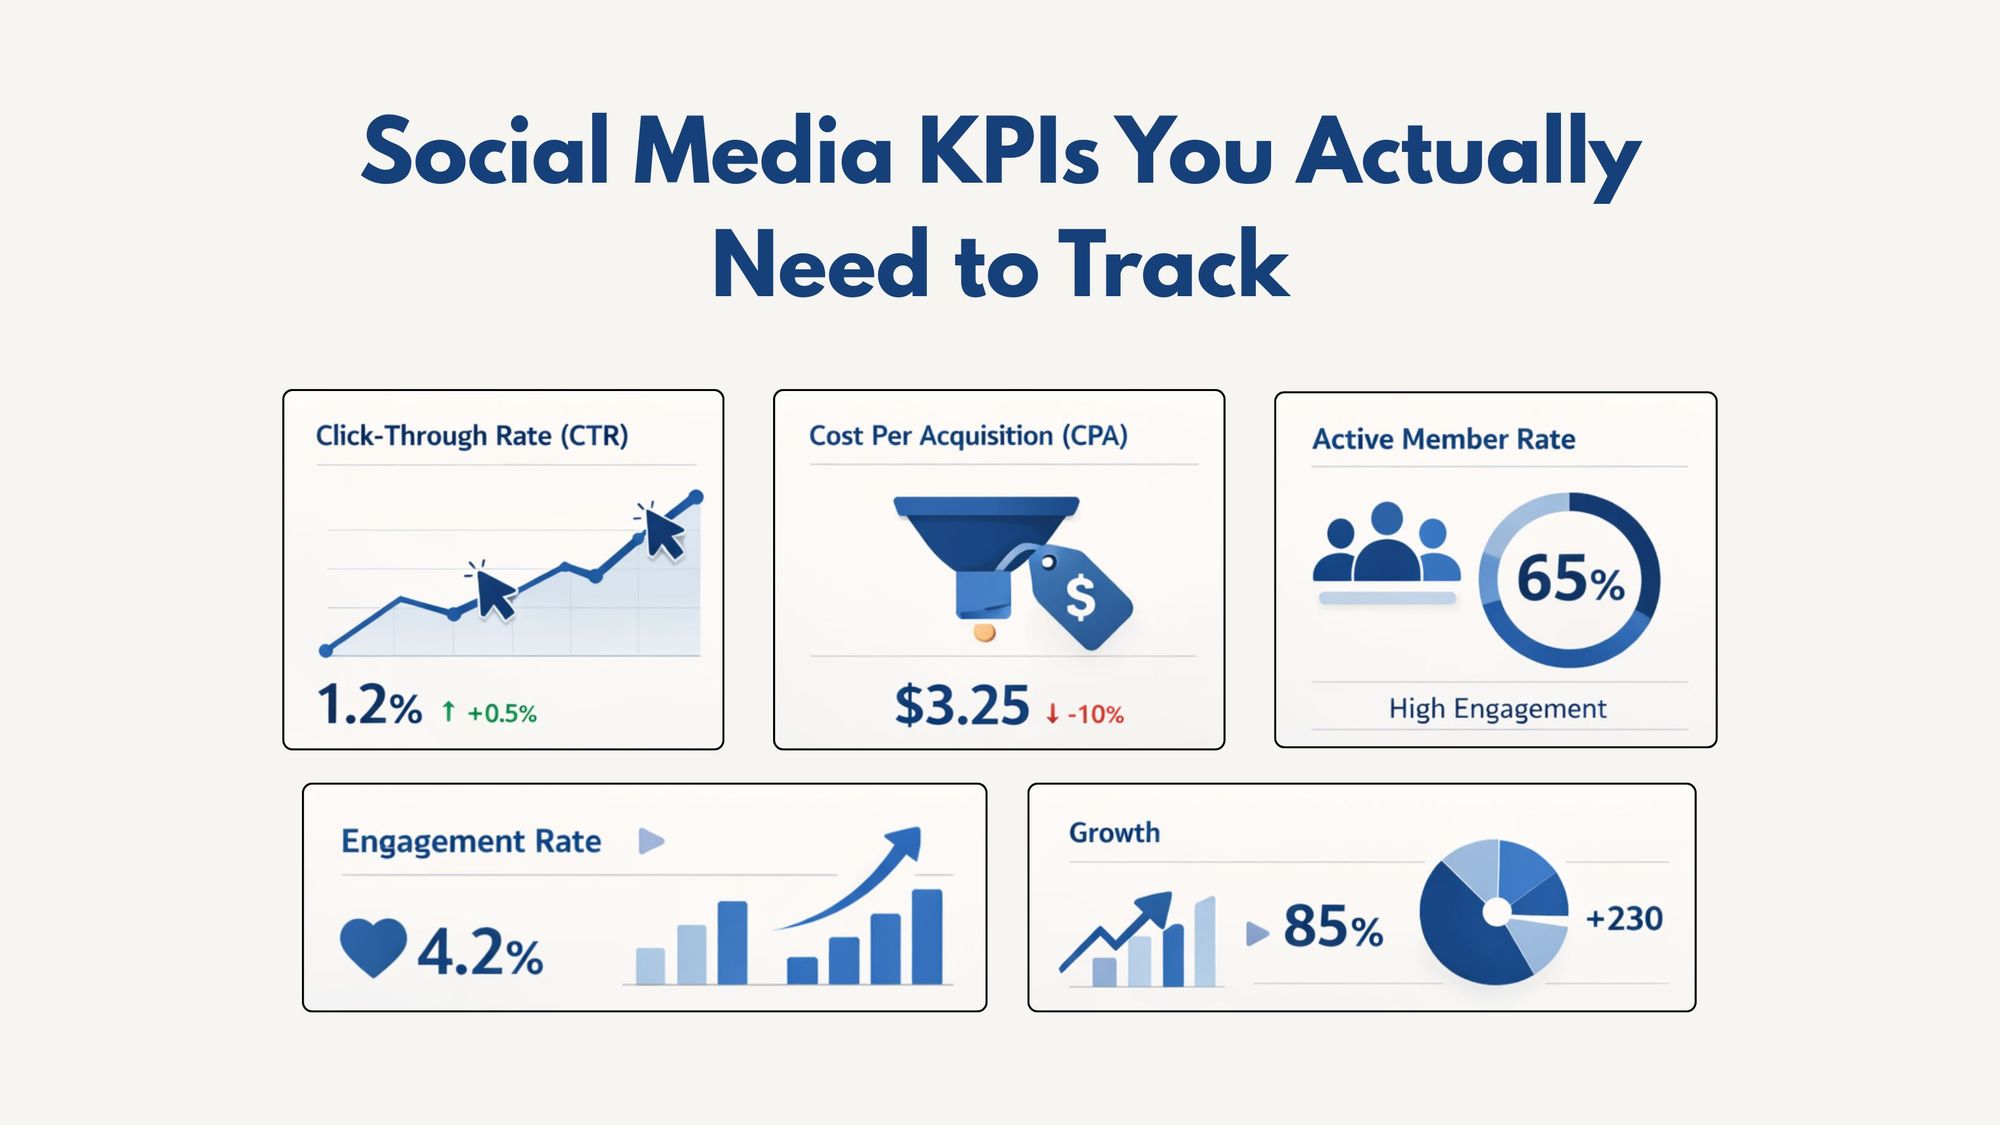
To win in 2026, you need to measure metrics that show actual buying intent, like your Click-Through Rate (CTR), Cost-Per-Acquisition (CPA), and Active Member Rate.
Why You Need to Track Social Media KPIs (Beyond the Basics)
Social media is full of data and user activity. It easily becomes confusing to determine what is actually working. Here is where the role of KPIs comes into play. They track how successful your social media strategies are in reaching specific targets, be it:
- Drawing an audience (reach)
- Sparking interactions (engagement)
- Turning curiosity into action (conversions)
- Gauging customer sentiment towards your brand (customer satisfaction)
You need a clear measurement framework because what gets measured gets done. You will recognize vital areas of improvement fast. For instance, let's say your B2B lead generation strategies aren't as robust as you want them to be.
Tracking your social media engagement and CTR will offer immediate insights into exactly where the funnel is breaking. Every campaign run on social media is a powerful learning opportunity.
How to Benchmark Your Performance Against Current Social Media Standards
Most marketing guides show you formulas for calculating engagement or CTR.
That’s useful, but it doesn’t answer the real question your boss will ask: “Is this performance actually good?”
Benchmarks solve that problem. By comparing your numbers with industry averages, you can quickly see whether your campaigns are performing well, falling behind, or outperforming competitors.
Below is a practical benchmark table based on recent social media and advertising reports for 2024–2026. Use these ranges as a quick reference when evaluating your campaigns.
| Metric | Platform | B2B Target | B2C Target |
|---|---|---|---|
| Engagement Rate | |||
| Engagement Rate | LinkedIn (Organic Posts) | 2.0% – 3.0% | 1.0% – 2.0% |
| Engagement Rate | Instagram (Posts/Reels) | 0.5% – 1.0% | 0.5% – 1.5% |
| Engagement Rate | Facebook Groups | 2.0% – 5.0% | 2.0% – 5.0% |
| Click-Through Rate (CTR) | |||
| Click-Through Rate (CTR) | Organic Social Links | 0.2% – 0.5% | 0.5% – 1.0% |
| Click-Through Rate (CTR) | Paid Social Ads | 0.5% – 1.0% | 0.8% – 1.5% |
| Cost and Activity Metrics | |||
| Cost-Per-Click (CPC) | Paid Social Ads | $2.00 – $5.00+ | $0.50 – $2.00 |
| Active Member Rate | Facebook Groups (Monthly) | 40% – 60% | 50% – 70% |
What These Numbers Actually Mean
Benchmarks are not strict rules. Instead, they help you interpret your data quickly. Here is how to think about them:
- If your numbers fall below the benchmark: Your targeting, social media content quality, or distribution strategy likely needs improvement.
- If you are within the benchmark range: You are performing around the industry average.
- If you exceed these benchmarks: You are likely outperforming most competitors in your niche.
For example:
- A 3% engagement rate on LinkedIn is considered excellent for B2B brands.
- A CTR above 1% on paid social ads usually indicates strong creative and highly accurate targeting.
- Facebook Groups with 50%+ active members are considered highly engaged, profitable communities.
This is exactly why community-driven platforms, especially Facebook Groups consistently outperform traditional, public-facing social media pages in raw engagement.
The Core Social Media KPIs to Track
To maintain your historical data, you still need to monitor the four core pillars. Check your social media analytics tools to keep track of these baseline figures.
1. KPIs for Reach
- Number of Followers: It gives a snapshot of the size of your audience. Quality matters more than quantity here.
- Impressions: This is measured every time a user's news feed displays your content. A large number of impressions means your content is spreading, but it does not guarantee success.
- Reach: Reach is where we explore unique views. It measures how many distinct users have seen any post.
- Share of Voice (SOV): SOV calculates what portion of online discussions belongs to your brand compared to competitors. You will need dedicated social listening tools to track this metric accurately.
- Web traffic: Measure web traffic from social media channels as another marker for success. Track referrals in Google Analytics for hard data.
2. KPIs for Engagement
- Clicks: A measure of user curiosity. Analytics provided on each platform will let you monitor these clicks on links, images, or CTAs.
- Shares: Shares show how often users spread your content. The more shares, the wider your reach.
- Comments: Any comment indicates a higher level of user involvement. They start a conversation about your post.
- Average Engagement Rate: This shows the average interactions per post relative to the total follower count.
3. KPIs for Conversions
- Conversion Rate: Conversion rate measures the users who took an action after clicking on your post.
- Click-through rate (CTR): CTR means what share of your audience clicked to learn more.
- Cost-Per-Click (CPC): CPC sees how much you're paying for those clicks. Divide your total spend on an ad campaign by the number of clicks it receives.
- Revenue: Track revenue generated from social media to see its impact on your bottom line.
4. KPIs for Customer Satisfaction
- Customer Satisfaction Score (CSAT): A direct indicator of customer happiness. These quantify how customers feel about your service through direct survey responses.
- Customer Lifetime Value (CLV): CLV offers insight into long-term relationships. This metric measures a customer's value over their time with your brand.
How to Diagnose and Fix a Flatlining Social Funnel
When your numbers tank, staring at a dashboard will not fix it. You need an operational workflow. Here is how to troubleshoot the three most common KPI failures so you know exactly what to change today.
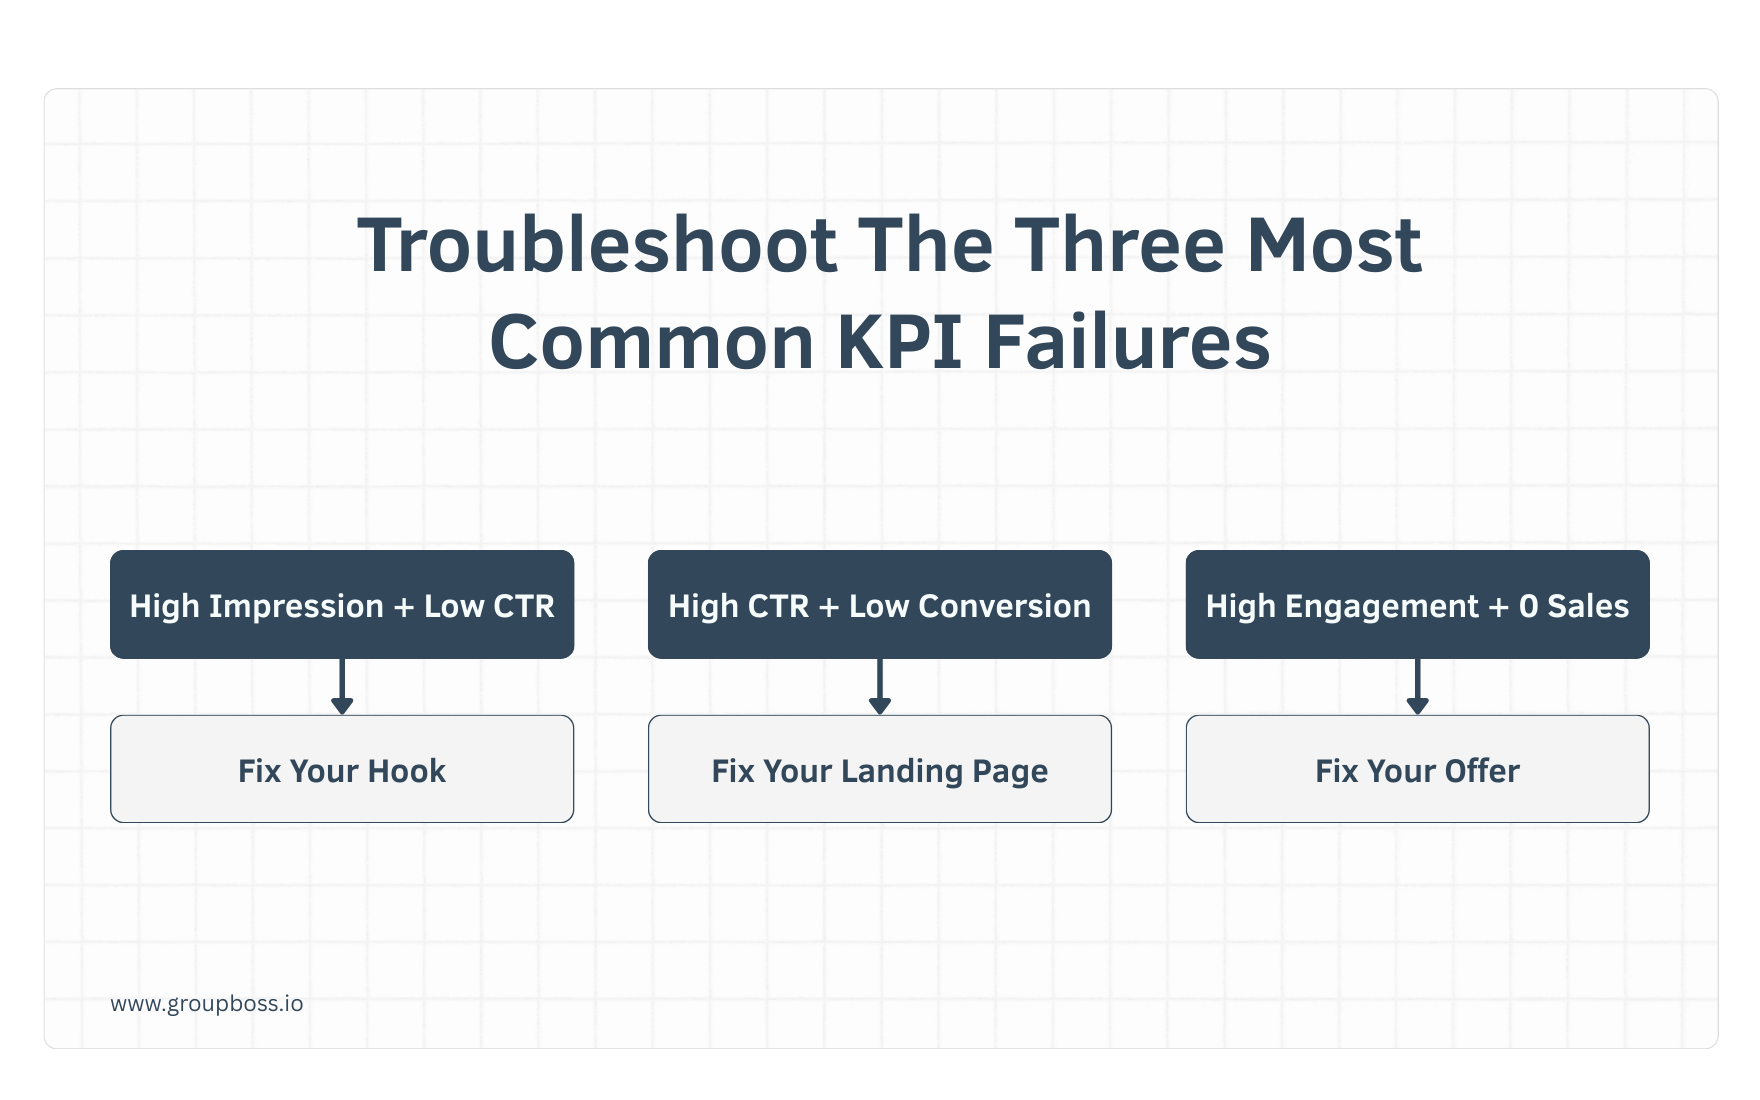
- High Impressions, Low Click-Through Rate (CTR): Your platform reach is fine, but your hook is weak. The algorithm likes your topic, but users do not care enough to click.
The Fix: Rewrite your headline, make the offer undeniable, and ensure your link is visible without the user having to click "read more."
- High CTR, Low Conversion Rate: Your post did its job perfectly, but your landing page is dropping the ball.
The Fix: Check your mobile page load speed immediately. Ensure the headline on the page exactly matches the promise you made in the social post, and implement proven social media conversion strategies to fix the leaks in your landing page..
- High Engagement, Zero Sales: People love your content, but they are not buyers. You built an audience of fans, not prospects.
The Fix: Pivot your content away from entertaining trends. Start answering the specific, painful questions your ideal buyer asks right before they pull out their credit card.
How to Track Community Health
Every massive software company tells you to track likes and shares. They completely ignore the private spaces like Facebook Groups where actual purchasing decisions happen.
If you want to dominate your niche, stop treating social media like a billboard and start tracking these three community KPIs and start tracking these three community KPIs:
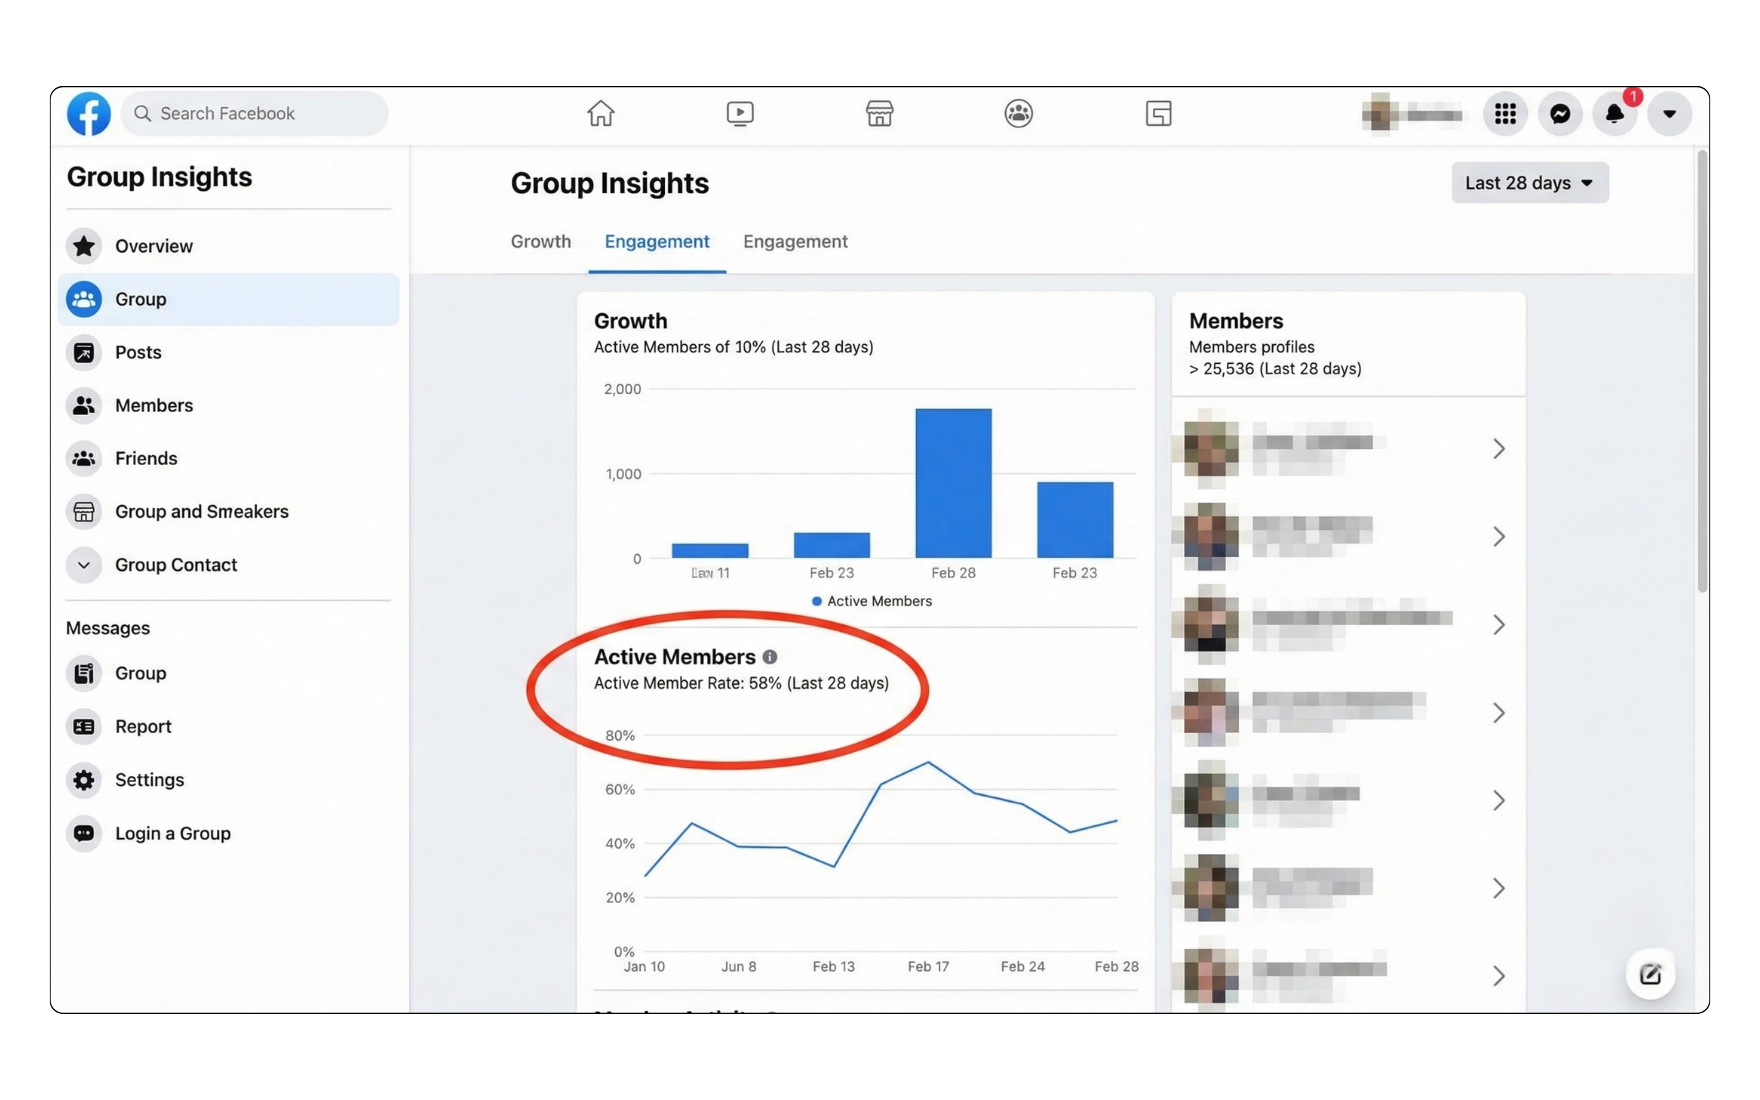
- Active Member Rate: Measure the percentage of your group that logs in and comments every week. A 500-person group with a 60% active rate will always outsell a 10,000-person group with a 2% active rate.
- Member-to-Member Interaction Ratio: Are you the only person posting? A profitable community runs itself. Track how often members reply to each other without your prompting.
- Group Welcome Conversion Rate: When a new person joins your group, do they take your introductory offer? Track the exact percentage of new members who hand over their email addresses in your group membership questions.
One cannot deny the potential of social media data. Sure, tracking social media KPIs requires effort. But a winning social strategy becomes possible with these metrics at your disposal.